Geophysical exploration for critical minerals
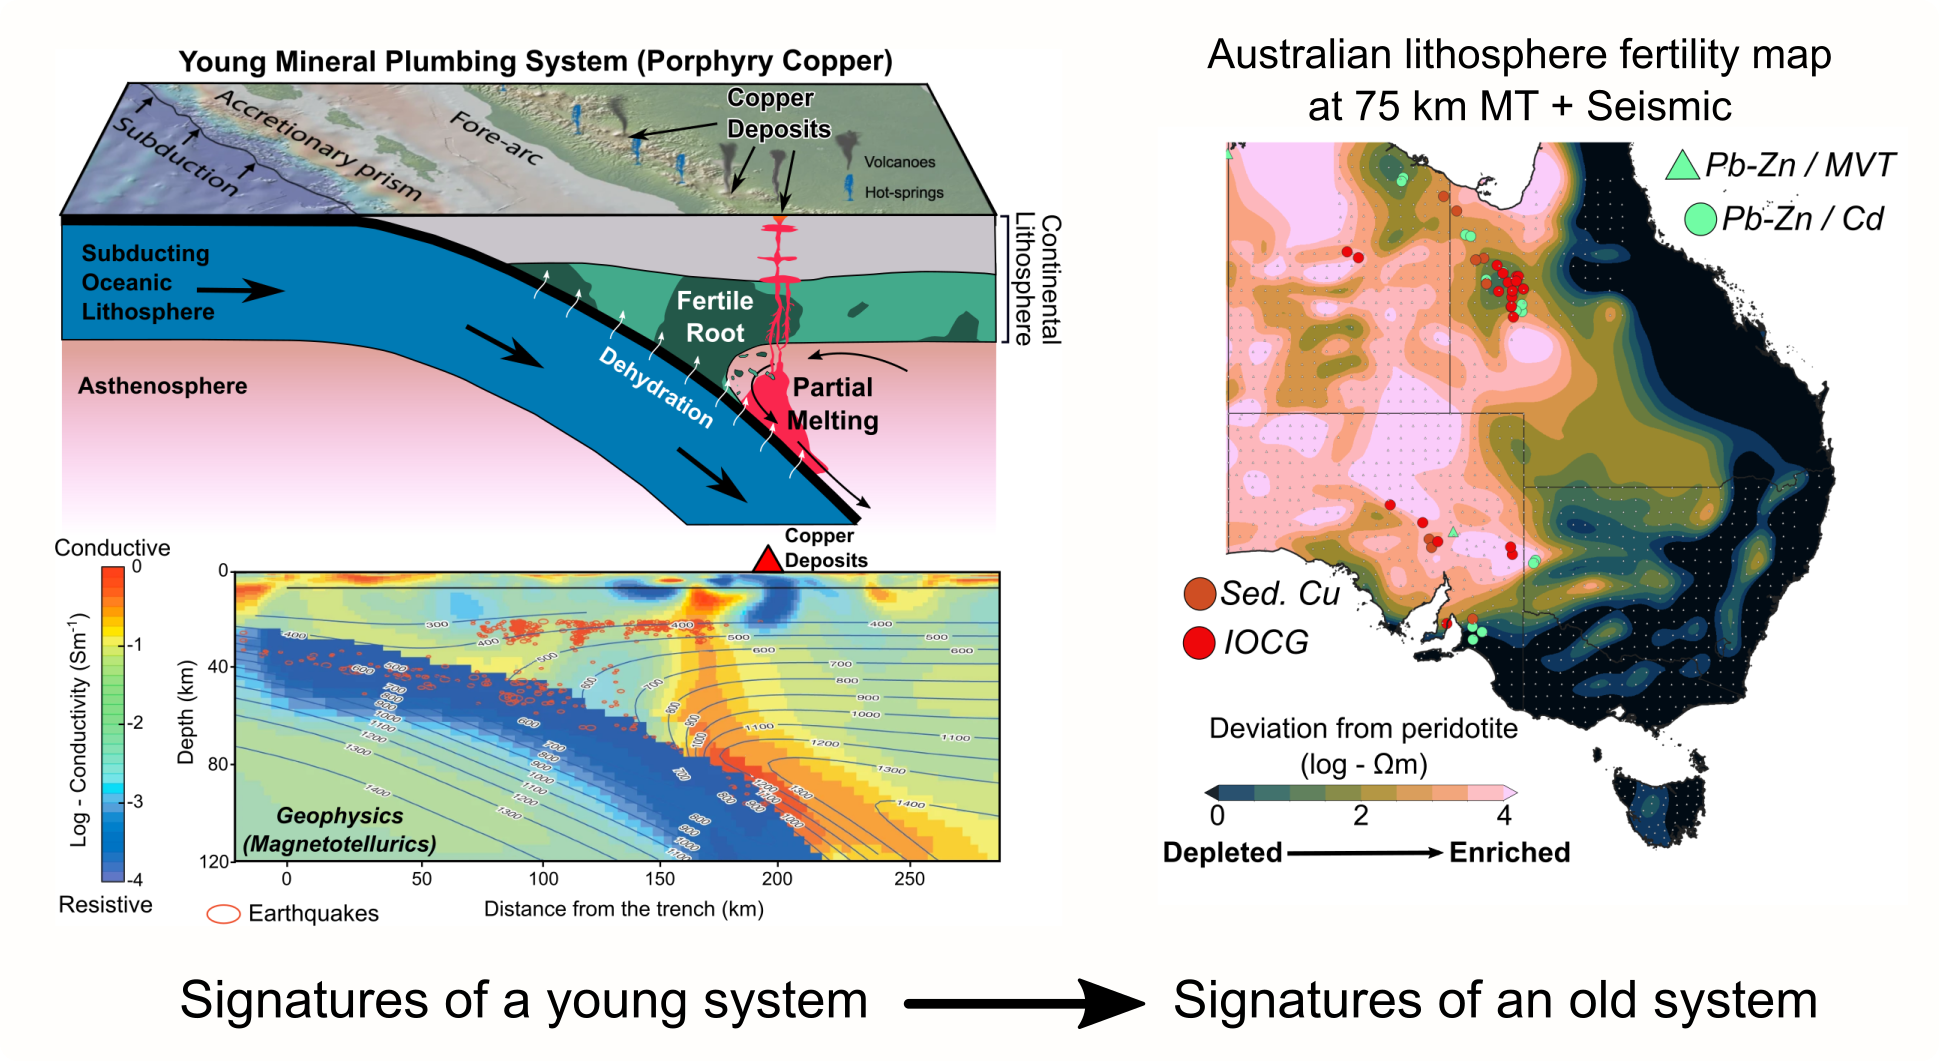
Australia’s transition to net-zero depends on finding new sources of critical minerals hidden beneath sedimentary cover. My work contributes to this by combining geophysical data, such as magnetotellurics, seismic tomography, and potential field methods, constrained by laboratory measurements, to better understand where these minerals form and how their systems come together.
World-class deposits are rare because they demand a coincidence of circumstances. You need a fertile source region, a lithospheric architecture that lets metals move, a transient event to remobilise them, and then the good fortune of being preserved rather than erased by later tectonics.
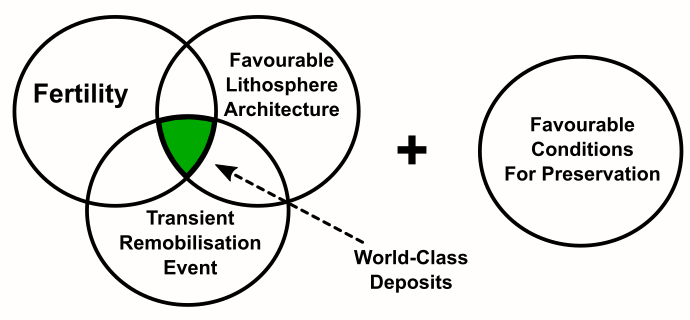
The ingredients of a world-class deposit, after McCuaig & Hronsky, (2014).
My research approaches this from two directions. At the deep end, I use large regional geophysical datasets to map fertility (e.g; Özaydın et al., 2024; Özaydın et al., 2022; Özaydın & Selway, 2022; Manassero, Özaydın, et al., 2024) and trace how it connects to lithospheric architecture and tectonomagmatic history, work that sits at the heart of the current ARC Discovery Project in southeast Australia. But mapping the deep plumbing system alone isn’t enough, since a deposit’s post-depositional history can obscure or destroy the very signatures we rely on to find it. This led me to start interpreting synthetic geophysical models through thermomechanical models (Özaydın et al., 2026), tracking not just the conditions that made a region fertile and gave it the right architecture, but also those that allowed a deposit to survive once it formed. At the other end, I characterise the tip of the mineral system directly, through high-resolution surveys and petrophysical constraints. Our recent Broken Hill study (AlQahtani, Özaydın, et al., 2026) is a case in point, where a world-class deposit turned out to sit in resistive crust with no clear conductive link to depth, and later metamorphism may have erased any original connection. Australia is a fortunate place to do this kind of work. The continent has been tectonically quiet for a long time, so fluids and melts, which dominate conductivity elsewhere, are largely absent at depth. With those competing explanations off the table, and with nearly every other rock-forming mineral being resistive, a conductor in the Australian lithosphere is far more likely to be telling us about sulphides, making electromagnetic methods an incredibly tool for finding mineralised systems here.
Electromagnetic Induction Methods
Electromagnetic induction methods use variations in the Earth’s magnetic field to image how well rocks conduct electricity, from the near surface down through the lithosphere and into the deep mantle. Magnetotellurics is the most widely used of these, drawing on natural field variations to resolve structure from a few metres to a few hundred kilometres depth, while satellite and observatory-based geomagnetic induction can probe far deeper still. The appeal is that electrical conductivity is particularly sensitive to small amounts of fluids, melts, and metallic phases, the very things most other geophysical methods can’t see. The difficulty is that a conductive anomaly can be caused by any number of things, and telling them apart is rarely straightforward.
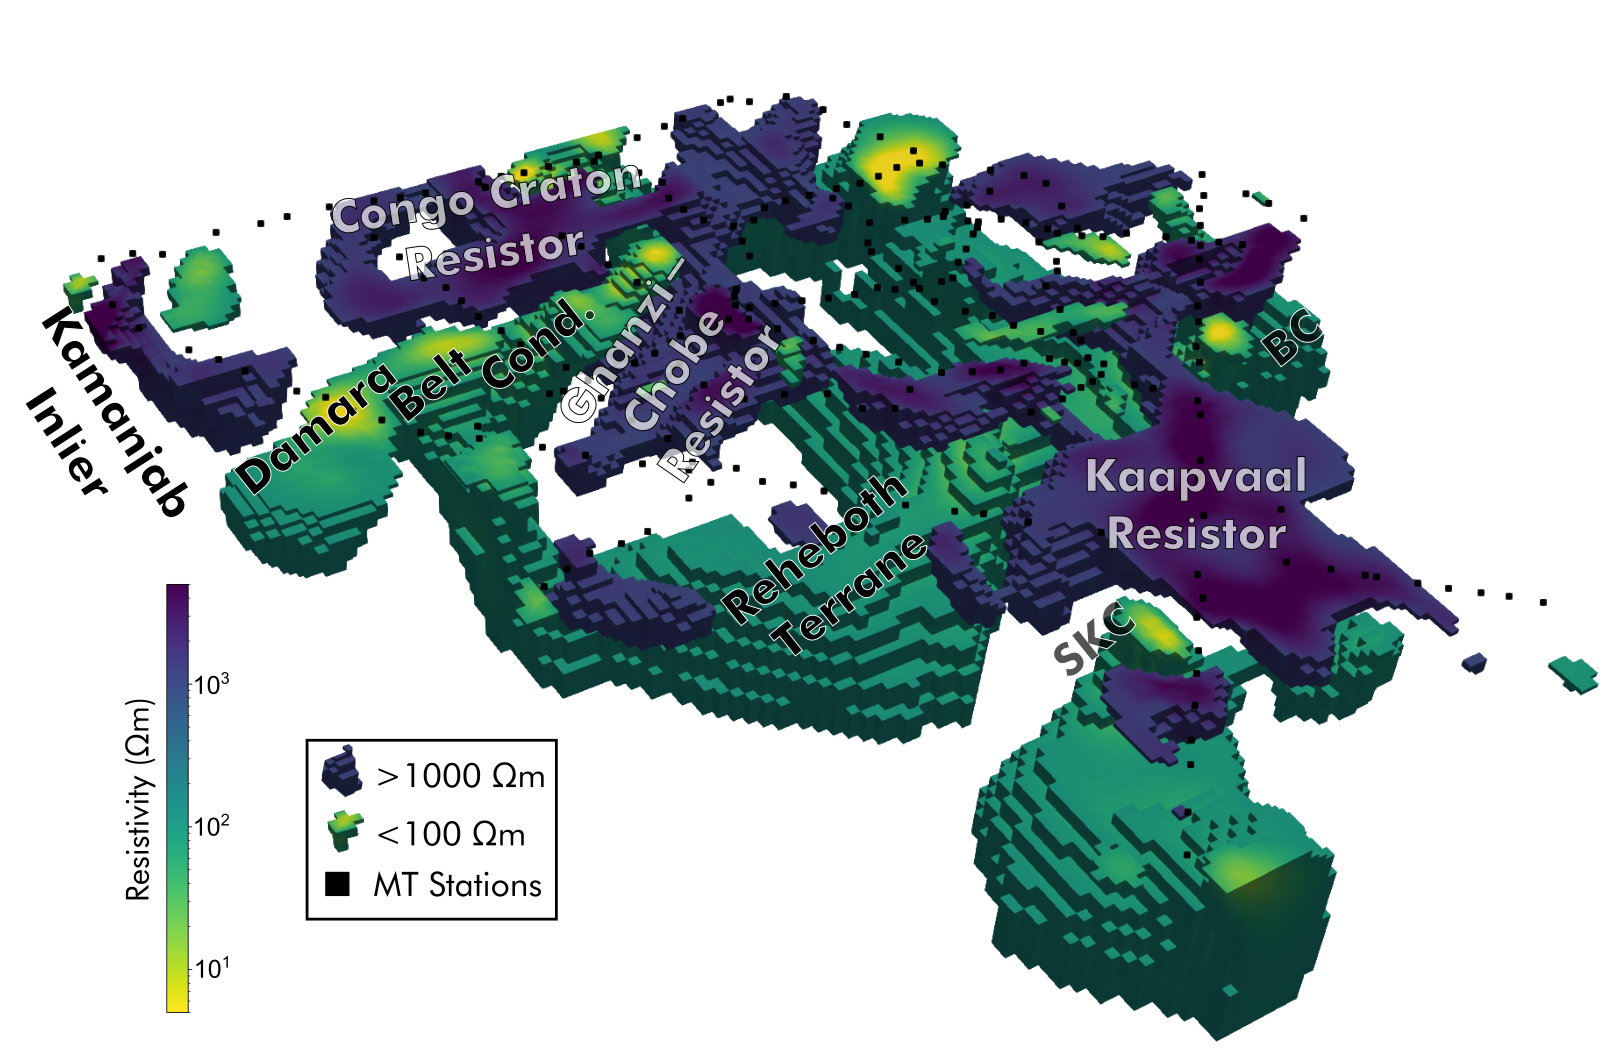
3D contour plot for values ≤1000 Ωm and ≥100 Ωm. BCC: Bushveld Complex Conductor, SKC: Southern Kaapvaal Conductor (Özaydın et al., 2022).
I’ve worked with electromagnetic data across a wide range of settings, from stable cratons to the East African Rift and active fault zones, and much of my research has focused on this interpretation problem. Rather than treating a conductivity anomaly as something to be explained qualitatively, I build frameworks that link these signals back to laboratory measurements of how real rocks and minerals behave at depth, so an anomaly can be read as a statement about composition, temperature, or melt rather than left ambiguous.
Composition and metasomatism in the lithospheric mantle
The continental lithosphere isn’t a uniform slab of rock. Over billions of years it gets chemically modified by melts and fluids passing through it, a process called metasomatism, which leaves behind water (hydroxyl, OH-), hydrous minerals, carbonates, graphite/diamond and sulphides in otherwise depleted mantle. These additions are volumetrically tiny but electrically significant, which makes conductivity a good tracer of where the mantle has been modified and where it hasn’t. Seismic velocities respond to the same metasomatic additions, but differently, since they are more sensitive to bulk composition and temperature. Interpreting the two together therefore narrows down what a given anomaly can be, separating a hydrated mantle from one carrying melt or sulphides in a way neither method manages alone.
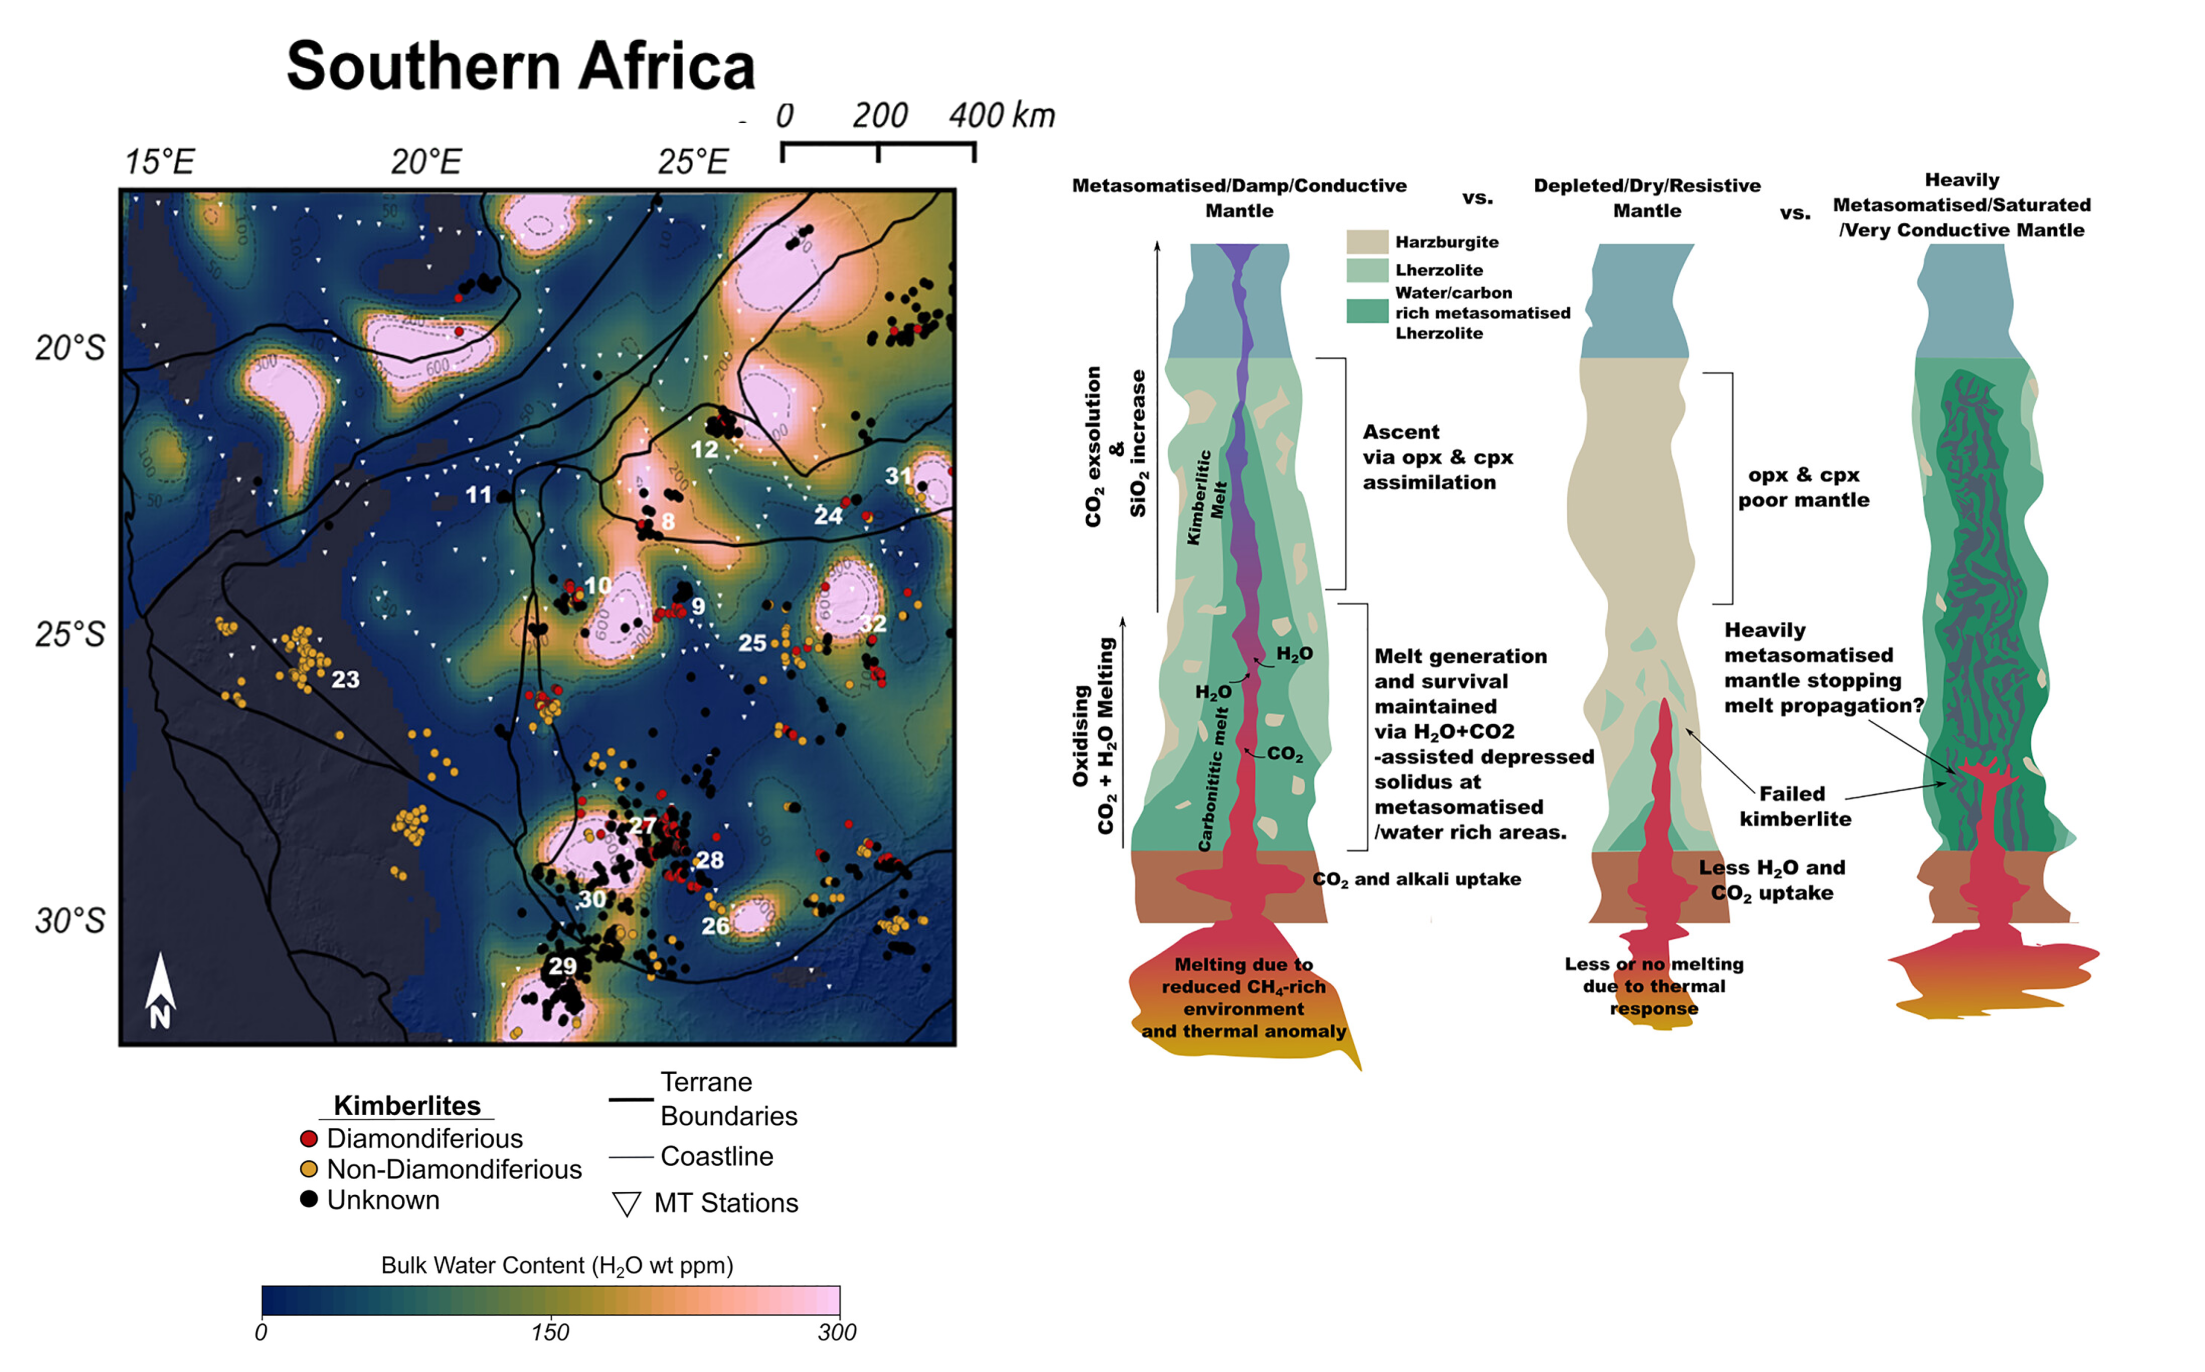
My work on southern Africa took this on directly, comparing geochemical data from ~38,000 garnet xenocrysts against magnetotelluric models to test how well conductivity actually compares to compositional variation in southern African mantle (Özaydın et al., 2022). Depleted mantle turned out to be largely resistive, but the fertile mantle was far less predictable, its conductivity depending on what happened to it afterwards rather than on sampled composition alone. Looking at this globally produced something very consequential for exploration. Kimberlites, the exotic magmas that carry diamonds to the surface, surround the most conductive parts of the mantle without sitting on top of it, and avoid the most resistive/depleted lithosphere entirely, occupying a Goldilocks zone in between (Özaydın & Selway, 2022). This has a practical significance for diamond exploration, since it means conductivity models can be used to narrow down where kimberlites are likely to occur rather than just describing the mantle after the fact.
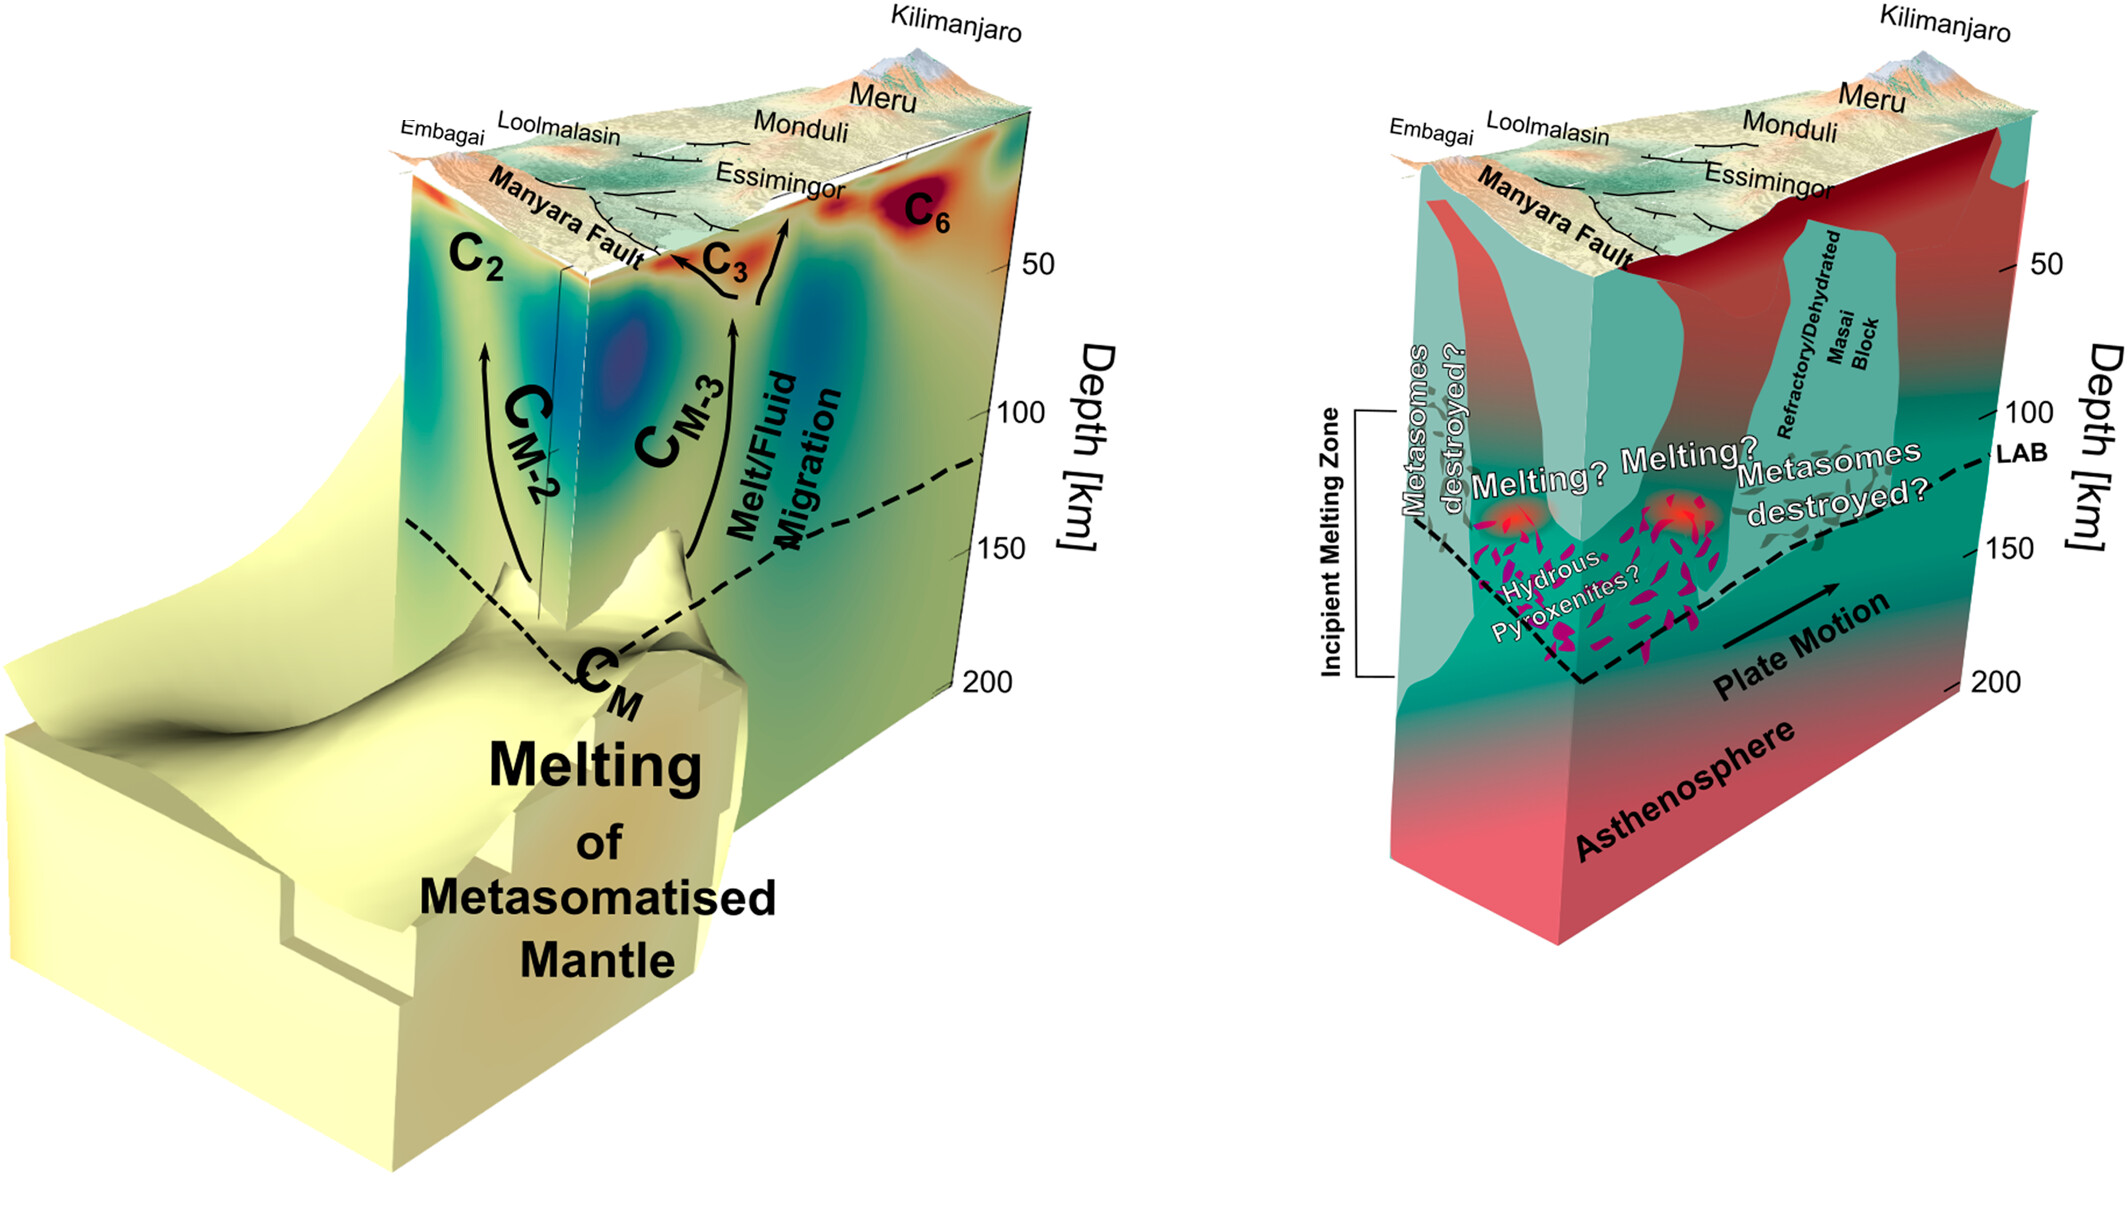
In Eastern Africa, the lithosphere is actively being pulled apart. 3D magnetotelluric modelling at the Northern Tanzanian Divergence showed metasomatised mantle beneath the craton and the younger southern rift, but a dry, resistive lithosphere where Cenozoic magmatism has been most voluminous, suggesting the melting has consumed the metasomes and dehydrated the mantle (Özaydın et al., 2024). Since those same metasomatic phases and carbon-rich melt are what weaken lithosphere enough to rift, this sets up a self-limiting process where extension destroys the very material that enables it. Southeast Australia (NSW & Vic) let us test this properly. Working with Constanza Manassero (Manassero, Özaydın, et al., 2024), we jointly inverted magnetotelluric and seismic data probabilistically. The metasomatised regions we mapped line up with the volcanoes, and with the old subduction-accretion boundaries that built eastern Australia, suggesting the intraplate volcanism there comes from melting enriched lithosphere near steps in the LAB rather than from a deep plume.
Geodynamic Modelling to Constrain Geophysical Signatures
Non-uniqueness is the thing that limits what we can say from geophysical data. Many different models fit the same measurements, and smoothing pushes the answer toward whatever is simplest rather than whatever is geologically sensible. Adding prior information helps, but the prior needs to come from somewhere defensible.
Geodynamic models are a good candidate. They produce strain, temperature and pressure fields that are physically consistent by construction, so converting them into synthetic geophysical observables gives you a plausible answer to compare against. In our Geology paper (Özaydın et al., 2026) we did this for a pull-apart basin and found that strain sets where the conductors form, and that the rounded blobs we see in real inversions are probably thin shear zones the data can’t resolve.
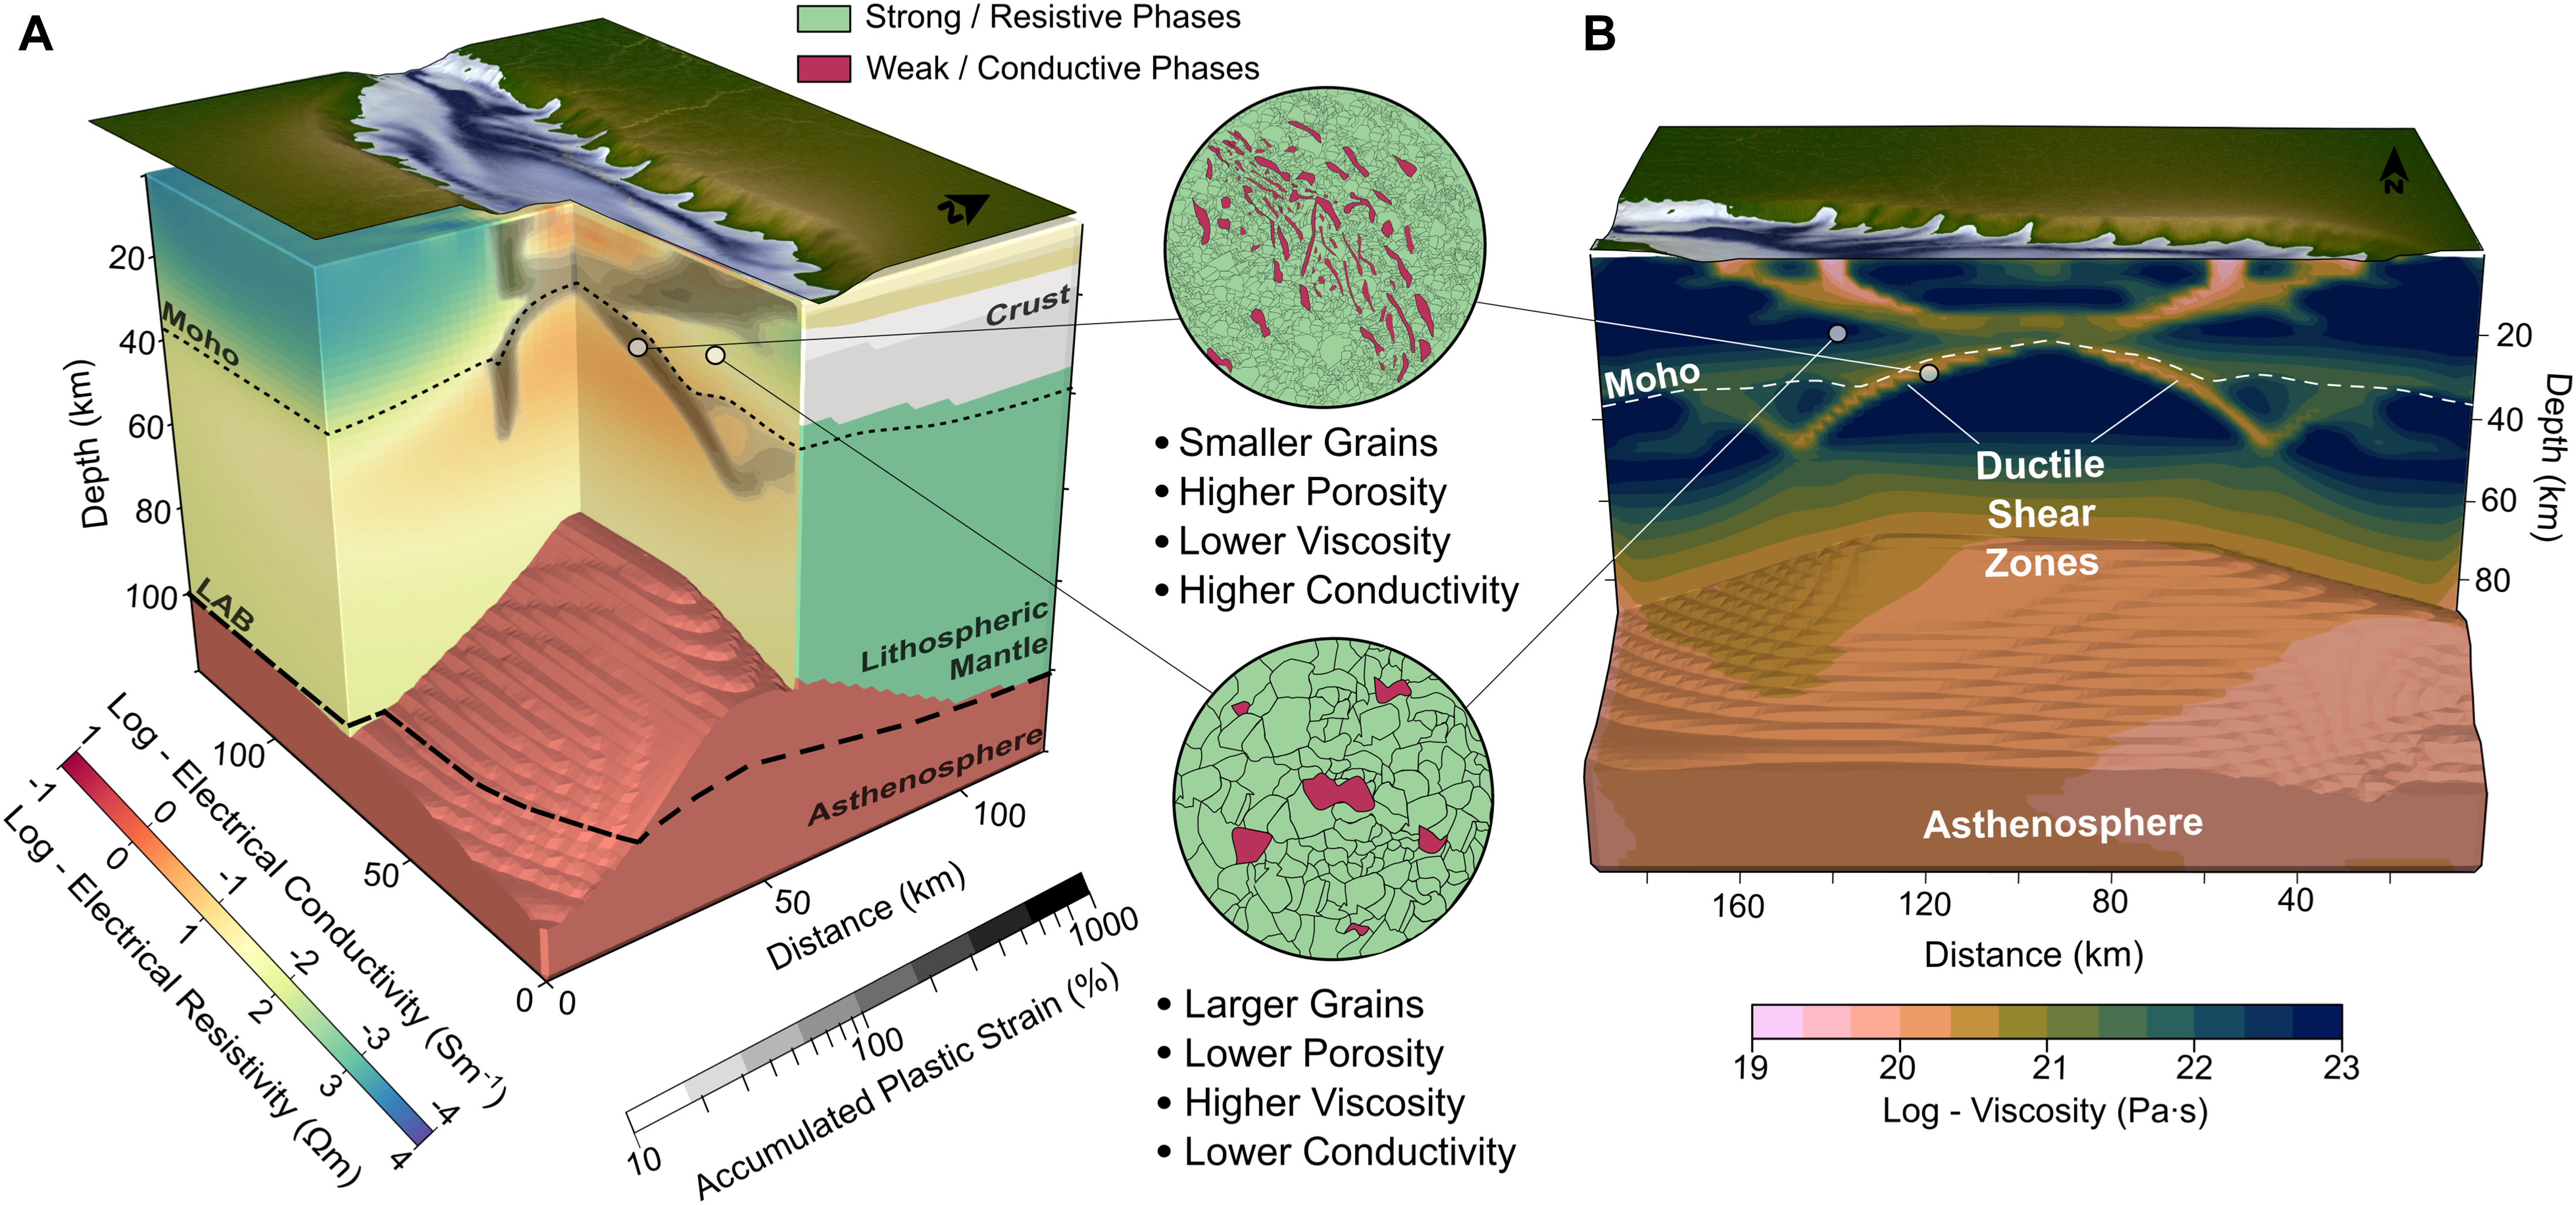
Where I want to take this is mineral systems. A deposit’s geophysical signature is not just a record of how it formed but of everything that happened afterwards, and thermomechanical models let you follow both. The aim is to work out which tectonic histories preserve a signature and which erase it, so we know what we should actually be looking for.
Open Source Tools
I develop open-source software for my research. MATE was the first, focusing on interpreting mantle MT models in terms of water content and mineralogy. pide is the more recent one, calculating conductivity and seismic velocity from temperature, pressure and composition using experimental data from the literature. You can use it to invert geophysical anomalies for composition, or to turn a thermomechanical model into synthetic MT, seismic, gravity and magnetic data. SAnTex, developed by Utpal Singh, calculates full elastic tensors and handles the seismic side.
- MATE — https://github.com/sinanozaydin/MATE
- pide — https://github.com/sinanozaydin/pide
- SAnTex — https://github.com/utpal-singh/SAnTex
All three are modular and open source, so anyone can adapt them to their own work. For more information, visit the Software tab.